VEGETATION INDICES IN PRECISION AGRICULTURE
Introduction
As discussed in previous publications, precision agriculture is currently very much in vogue. This methodology makes it possible to measure and manage the variability of soil properties, i.e. spatial variability, in order to increase production efficiency and reduce environmental impact. For this reason, it is necessary to define two very important concepts: spatial variability, which expresses the differences in production in the same field, the same season and harvest; and temporal variability, which refers to the changes in production in the same field, but in different harvest seasons. It is therefore established that it corresponds to a set of technologies that allow the variable application of agricultural inputs such as fertilisers or pesticides, depending on the requirements and/or the productive potential of various sectors within the plot, previously defined. It is not only a matter of measuring this variability, but also of implementing a series of practices that are carried out in accordance with this variability. The observation of the existence of variability with respect to the properties or determinants of production is not new, but the difference lies in the ability to identify, quantify and map it.
This methodology can be divided into four phases: data collection, processing and interpretation of the information, decision making and action in the field. Based on these, a series of practices are defined in a cycle aimed at replacing the usual recommendation, used in traditional agriculture, of inputs based on average values with a much more precise one of localised management, which takes into account the variations in the yield of the entire area of the farm. The set-up optimises input use by depositing in the soil the amount of seed that each point supports, the amount of nutrients that are required and, in addition, weed, pest and disease control is carried out only where there is a real demand for control. Localised management practices are not only based on productivity or soil fertility maps. Decisions can be made on the basis of a database or information obtained at the very moment the actions are to be carried out, using real-time sensors.
In short, the adoption of precision agriculture, understood as a concept, is a tool with great potential for rationalising the modern agricultural production system, as it optimises the amount of agrochemicals applied to soils and crops, among many other elements, reducing production costs, as well as environmental pollution levels and improving the quality of harvests.
Vegetation indices
As their name indicates, vegetation indices are related to the study of vegetation cover, which constitutes one of the first research focuses within the evaluation and management of natural resources, through the application of remote sensing techniques, which at the time were satellite images obtained from the launch of the LANDSAT series. They are related to a set of algebraic operations, which are performed on the numerical values of the different pixels, using two or more bands belonging to the same point. They can be defined as the parameter obtained as a result of the combination of two or more reflectance values at different wavelengths, with which some specific characteristic of the crop can be highlighted, such as estimation of the loss of biochemical constituents of chlorophyll or water or the detection of changes in leaf pigments or in chlorophyll fluorescence. It is established that the ideal index is sensitive to plant cover, insensitive to soil brightness and colour and little affected by atmospheric disturbances, environmental factors and the geometries of illumination and observation.
As a general rule, low index values indicate that the vegetation in the study area is not very vigorous, while higher values indicate high vigour. This is not the case for all indices, since in certain cases, such as the RVI and NRVI indices, which will be discussed below, the index value is inversely proportional to the amount of vegetation present.
The indices can be classified into those based on slope and those based on distance. The former are those that use the ratio of the reflectance of one band to another, generally corresponding to the red and near-infrared, as a consequence of the high contrast in chlorophyll reflectance in both bands. The term “slope-based” refers to the fact that, when analysing the resulting index values, the slopes of the lines passing through the origin and the pixels plotted on a graph are essentially compared, with the reflectance of one band located on the X-axis and the reflectance of the other on the Y-axis. In distance-based indices, the reflectance values that are recorded by the selected sensors are obtained from an average reflectance of all the coverages that lie within the same pixel. Since they try to separate the information between vegetation and ground, it can be established that they are based on the use of a ground line and the distances from it. The name ground line refers to a linear equation that describes the relationship between the reflectance values of the red band and the near infrared for the pixels representing the ground. This line is generated by fitting a linear regression between the red band and the near IR for a sample of soil pixels free of any type of vegetation. It can also be done by generating a dispersion map between the infrared band, which is located on the Y-axis, and the red band, which is represented on the X-axis, and plotting the line that best fits the base of the points on the graph. By doing this, the slope and the distance to the origin can be obtained. Once this relationship is obtained, all unknown pixels that have the same relationship between reflectance values are assumed to be bare ground. On the contrary, those that are far from the ground line and have a higher reflectance response (near infrared) are considered as vegetation. Water bodies are observed as higher red reflectance.
Of these, the most representative are presented below, i.e. those most commonly used in precision agriculture.
Slope-based indices
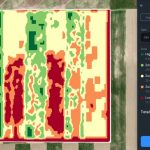
NDVI (Normalised Difference Vegetation Index): is one of the most common, as it is used for all kinds of applications. The main reason why it is so widely used is because of its simplicity of calculation. It also has a fixed range of variation, established between -1 and +1, which allows thresholds to be established, facilitating the comparison between images. Its calculation is based on the contrast between the area of maximum absorption in the red, as a consequence of the presence of chlorophyll pigments, and the maximum reflection in the infrared, related to the cellular structure of the leaf. There is therefore a relationship between this index and the photosynthetic activity, the amount of biomass, the green area and the health of the crop. Very low values in the order of 0.1 represent rocky, sandy or snowy areas, while higher results between 0.2 and 0.3 correspond to areas poor in shrubs or natural pastures. The main drawback of this index is that it is very sensitive to the reflectivity of the soil, on which the plant is located, which considerably limits the discrimination potential. This situation is accentuated in places where the vegetation cover occupies less than 50% of the area being analysed, which is often the case even in cultivated areas. In order to solve this problem and to achieve a correct study of the vegetation, even in areas with a very low density, the vegetation indices described below have been developed.
Distance-based indices
PVI (Perpendicular Vegetation Index): considered as the main index, from which all others are derived. To calculate the values, it uses the perpendicular distance of each pixel to the ground line. The distinction between soil and vegetation cover, as explained above, is due to the distance of each pixel with respect to the ground line, thus, by taking into account the reflectivity provided by the soil, it is possible to isolate the information provided by the vegetation. Since the results are obtained on the basis of distances perpendicular to the ground line, expressed in reflectivity units, both the scale of measurement and the range of variation differ from those used in the NDVI and SAVI indices.
SAVI (Soil Adjusted Vegetation Index): since it also takes into account the reflectivity of the soil, it allows the information pertaining to the vegetation cover to be isolated from that pertaining to the soil beneath it. However, as with NDVI, if the vegetation cover is not sufficiently dense, erroneous reflectance values can occur, which are due to the underlying soil. Despite this fact, when used, two vegetation covers with the same photosynthetic activity, regardless of the soil on which they are located, will have the same or very similar values, contrary to what happens with NDVI.
There are other vegetation indices, also used in precision agriculture, but which are not classified on the basis of the previously described criteria, among which are the following:
CWSI (Crop Water Stress Index): relates the difference in temperatures measured with the vegetative canopy, understood as the complex structure formed by the spatial distribution of the leaves forming the crop and the air, to the difference between these two values when evapotranspiration is not restricted by water availability (lower limit) and the difference when evapotranspiration is zero, as a result of the lack of water availability (upper limit). It thus takes into account the transpiration rate of a crop by measuring the canopy temperature and the vapour pressure deficit. It provides a value from 0 to 1 which depends on the level of water stress of the crop.
LAI (Leaf Area Index): is an indicator of plant biomass and plant resistance. It is the dimensionless numerical expression resulting from the division of the leaf area of a crop, expressed in square metres, and the area of soil on which the crop is established, expressed in the same unit, i.e. the area it occupies. It is based on the fact that efficient crops tend to invest most of their early growth in the expansion of their leaf area, since it means a better use of solar radiation. It is related to the exchange of carbon, oxygen and water with the atmosphere.
NDRE (Normalised Difference Red Edge Index): this index uses the reflectance at 730 nm, i.e. it incorporates the spectral area of the red edge, thus replacing that of the red. It indicates the changes that can occur in the chlorophyll A and nitrogen content of the plant, as well as water stress. For this reason, it can indicate variability in relation to both fertiliser and foliar nitrogen requirements of plants. It is considered a better indicator of crop health or vigour than NDVI for mid to late season crops and is more suitable for intensive management applications, as NDVI can lose sensitivity when plants accumulate a critical level of leaf cover or chlorophyll content.
PCD (Plant Cell Density): Indicator of variability in crop vigour. Like NDVI it indicates photosynthetically active biomass. It is therefore correlated with size, health and absence of stress, which in turn is associated with the vigour status of the plant. The result is provided by a qualitative measurement.
TCARI/OSAVI (Chlorophyll Absorption Reflectance Index/Soil Adjusted Vegetation Index): The TCARI index, which measures the depth of chlorophyll absorption in the red relative to the maximum reflectance peaks at the green and red edge, is very sensitive to soil reflectivity, which is why it is complex to interpret in cases where the leaf area index has low values, which is why it is combined with the OSAVI index, which uses red and near-infrared bands to reduce that influence, enhancing sensitivity to variations associated with chlorophyll content. The data obtained through the combination of both indices serves as an indicator of nutritional stress and chlorosis situations in plants.